---
title: "01. Introduction to International Trade"
---
## Learning objectives
By the end of this chapter, you should be able to:
1. Define international trade and distinguish between exports and imports.
2. Explain why countries trade with each other.
3. Distinguish between international trade and international finance.
4. Calculate and interpret a simple trade openness ratio.
5. Describe how globalization affects firms, consumers, and governments.
6. Interpret basic trade indicators for Oman.
## Why this chapter matters
International trade affects what countries produce, what consumers buy, how firms compete, and how governments design economic policy. For a small open economy such as Oman, trade is especially important because domestic production, food imports, energy exports, shipping routes, and regional integration all connect the economy to world markets.
This course studies international trade from an applied agricultural and policy perspective. We will use trade theory, welfare analysis, WTO rules, regional trade agreements, and country-level applications to understand how trade affects national welfare and different economic groups.
## What is international trade?
International trade is the buying and selling of goods and services across national borders.
A country **exports** when it sells goods or services to other countries. A country **imports** when it buys goods or services from other countries.
A simple way to summarize the external goods and services position of a country is the trade balance:
$$
\text{Trade balance} = X - M
$$
where:
- $X$ is exports
- $M$ is imports
If $X > M$, the country has a **trade surplus**. If $X < M$, the country has a **trade deficit**.
International trade expands markets beyond national borders. This allows producers to sell to more consumers and allows consumers to access goods that may be unavailable, expensive, or inefficient to produce domestically.
## International trade and international finance
International economics has two broad branches.
| Branch | Main focus | Typical questions |
|---|---|---|
| International trade | Goods, services, production, welfare, and trade policy | Why do countries trade? What do they export and import? Who gains and who loses from trade? |
| International finance | Exchange rates, capital flows, balance of payments, and monetary issues | How do exchange rates affect trade? Why do currencies appreciate or depreciate? |
This course focuses mainly on **international trade**. We will still discuss exchange rates later because exchange rates affect export prices, import costs, food prices, and trade balances.
## Why do countries trade?
Countries trade because they are different. These differences create opportunities for mutually beneficial exchange.
### 1. Differences in technology
Countries may use different technologies to produce the same goods. If one country can produce a product with fewer resources, it may have a cost advantage.
This is the foundation of the **Ricardian model**, where trade is explained by differences in labor productivity.
### 2. Differences in resources
Countries differ in their resources. Some have more capital, some have more labor, some have more land, and some have more natural resources.
This is the foundation of the **Heckscher-Ohlin model**, where countries export goods that intensively use their abundant factors of production.
### 3. Differences in demand
Consumers in different countries may have different preferences. Some countries demand more wheat, rice, coffee, meat, dairy products, or luxury goods than others.
Demand differences can create trade even when countries have similar production technologies.
### 4. Economies of scale
Some goods become cheaper to produce when firms produce more of them.
When a firm can lower average cost by producing at a larger scale, access to foreign markets becomes valuable. Trade allows firms to sell more, specialize more, and sometimes reduce costs.
## Globalization
Globalization refers to the increasing integration of people, firms, markets, and governments across countries.
Globalization affects international trade in several ways:
- Firms compete with foreign producers.
- Consumers access more imported products.
- Exporters gain access to foreign markets.
- Governments coordinate trade rules through institutions such as the WTO.
- Supply chains become more international.
- Regional trade agreements become more common.
Globalization does not mean that all countries benefit equally. Trade can increase national welfare while also creating winners and losers within the country. This is one of the central themes of the course.
## Indicators of globalization
Common indicators of globalization include:
1. Growth in world trade volume.
2. Higher export and import shares in GDP.
3. Expansion of regional trade agreements.
4. Growth of foreign direct investment.
5. More international production networks.
6. Greater dependence on shipping, logistics, and digital communication.
One simple indicator is the **trade openness ratio**.
$$
\text{Trade openness} = \frac{X + M}{GDP}
$$
Sometimes it is reported as a percentage:
$$
\text{Trade openness (\%)} = \frac{X + M}{GDP} \times 100
$$
A higher value means that trade is large relative to the size of the economy. It does not automatically mean that the country is richer or better off. It simply means that the economy is more exposed to foreign markets.
## Trade openness: interpretation
Trade openness must be interpreted carefully.
A high openness ratio may mean that:
- the country is small and relies heavily on imports,
- the country exports natural resources,
- the country is a logistics or re-export hub,
- the country is deeply integrated into regional or global supply chains.
A low openness ratio may mean that:
- the country is large and can produce many goods domestically,
- the domestic market is relatively self-sufficient,
- the country has trade barriers,
- the country is less integrated into world markets.
So trade openness is a useful descriptive indicator, but it is not a complete measure of welfare, competitiveness, or diversification.
## Basic trade policy terms
The following terms will appear throughout the course.
| Term | Meaning |
|---|---|
| Free trade | Trade with no artificial restrictions such as tariffs, quotas, or unnecessary barriers. |
| Autarky | A situation where no international trade takes place. |
| Trade liberalization | A movement toward freer trade by reducing trade barriers. |
| Protectionism | A policy direction that restricts trade to protect domestic producers. |
| Tariff | A tax on imports or exports. |
| Quota | A quantitative limit on imports or exports. |
| Export subsidy | A payment or incentive given to exporters. |
| Regulation or standard | A rule affecting product quality, safety, labeling, or market access. |
In practice, countries rarely have completely free trade or complete autarky. Most countries are somewhere between these two extremes.
## The role of government in trade
Governments influence international trade through many instruments.
They may restrict imports using tariffs, quotas, standards, or licensing rules. They may promote exports through information services, export credit, trade fairs, and sometimes subsidies. They may also join international agreements to reduce trade barriers and increase predictability.
Trade policy creates distributional effects. For example:
- Import tariffs may help domestic producers but hurt consumers.
- Export subsidies may help exporters but cost taxpayers and distort trade.
- Food safety standards may protect health but can also restrict imports if misused.
- Regional trade agreements may create trade, but they may also divert trade from more efficient non-member countries.
Because of these trade-offs, trade policy is not just a technical issue. It is also a political economy issue.
## Oman as a trade-oriented economy
Oman provides a useful applied example for this course. The country is open to trade, has a strong hydrocarbon export base, imports many manufactured and food products, and is connected to regional supply chains through the GCC.
The following tables use Oman trade indicators from the WTO Trade Profile material used in this course.
### Key economic indicators
| Indicator | Value |
|---|---:|
| GDP, million current US dollars | 114,667 |
| GDP per capita, US dollars | 20,354 |
| Current account balance, percent of GDP | 3.3 |
| Trade per capita, US dollars | 9,949 |
| Trade, percent of GDP | 48.9 |
A trade-to-GDP ratio of 48.9 percent means that exports plus imports are equal to nearly half of GDP. This indicates meaningful integration with international markets.
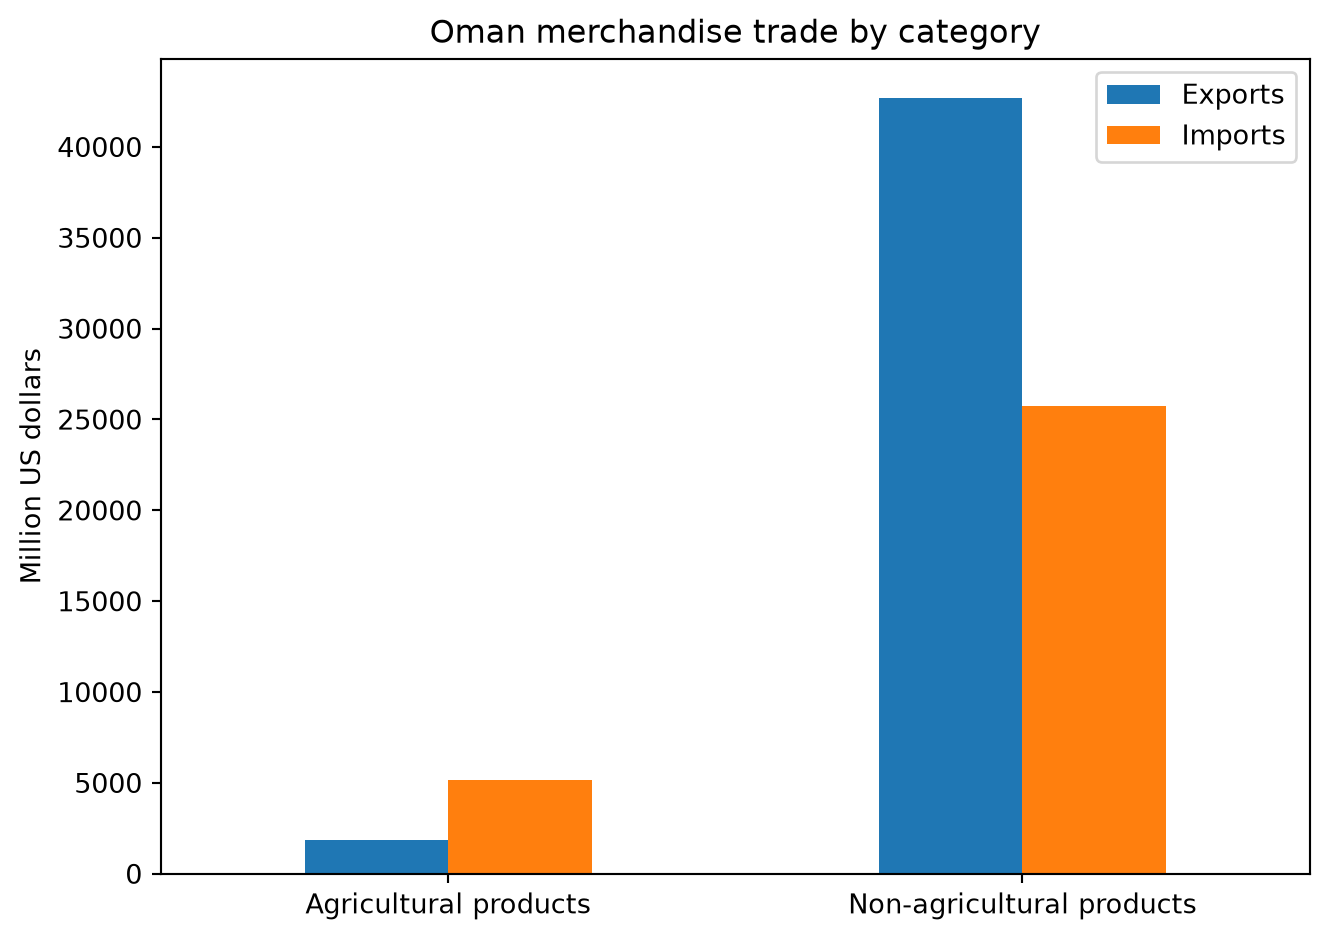
### Merchandise trade structure
| Category | Exports, million US dollars | Imports, million US dollars |
|---|---:|---:|
| Agricultural products | 1,834 | 5,133 |
| Non-agricultural products | 42,718 | 25,747 |
Oman's exports are dominated by non-agricultural products, especially petroleum and related industrial products. At the same time, Oman imports a substantial amount of agricultural products. This makes agricultural trade and food security important topics for policy analysis.
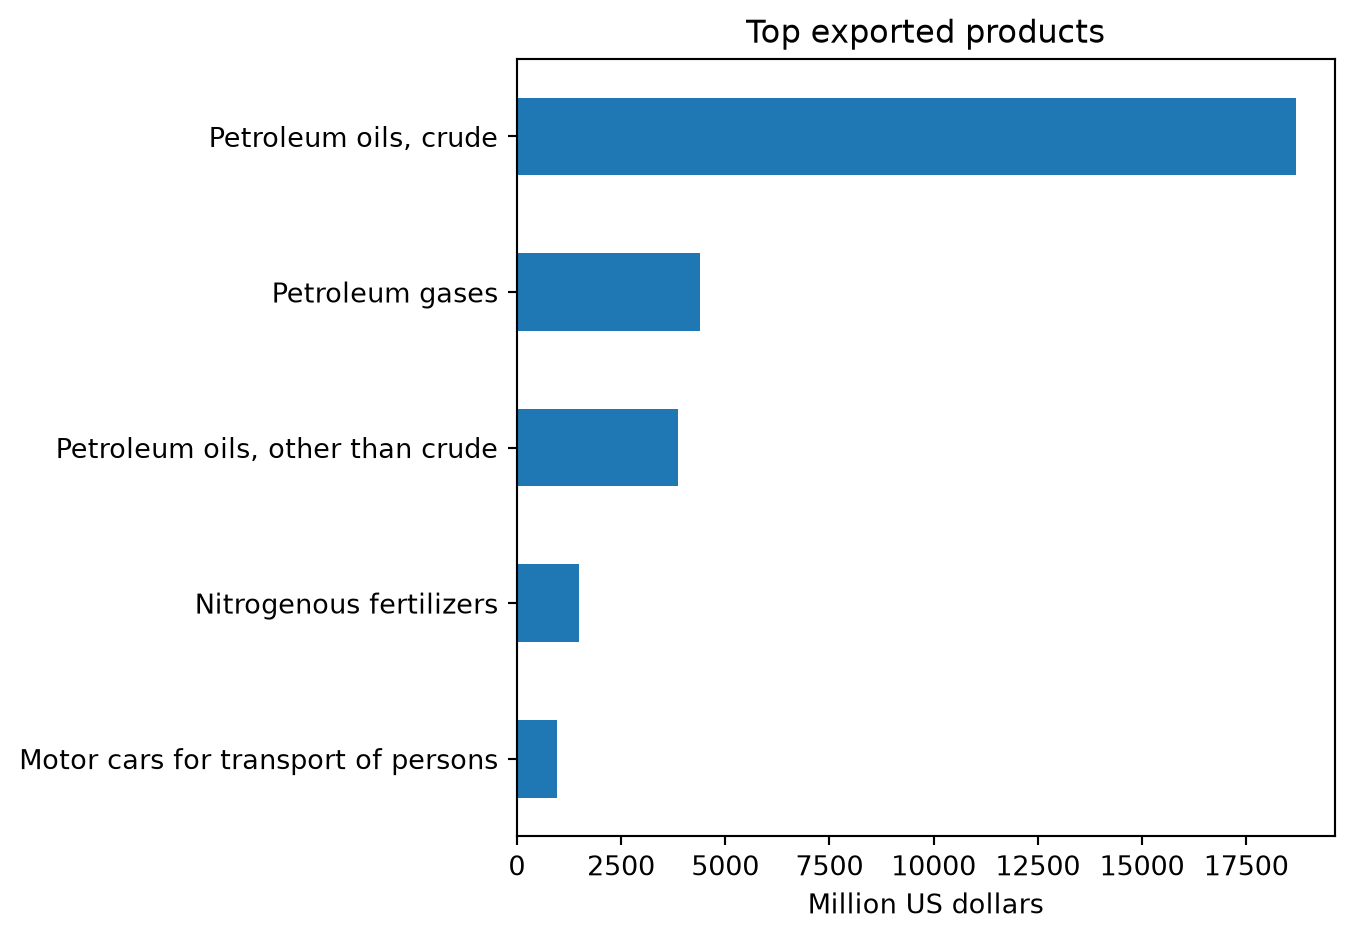
### Main exported and imported products
| Exported product | HS code | Value, million US dollars |
|---|---|---:|
| Petroleum oils, crude | HS2709 | 18,686 |
| Petroleum gases | HS2711 | 4,403 |
| Petroleum oils, other than crude | HS2710 | 3,865 |
| Nitrogenous fertilizers | HS3102 | 1,498 |
| Motor cars for transport of persons | HS8703 | 955 |
| Imported product | HS code | Value, million US dollars |
|---|---|---:|
| Petroleum oils, other than crude | HS2710 | 3,370 |
| Iron ores and concentrates | HS2601 | 1,876 |
| Motor cars for transport of persons | HS8703 | 1,730 |
| Radio-telephony transmission tools | HS8525 | 723 |
| Gold | HS7108 | 600 |
These product-level indicators show that Oman's exports are concentrated in petroleum and related industrial sectors, while imports are more diversified.
::: {.callout-note}
## Interpretation
Oman's trade structure suggests strong dependence on hydrocarbons and related non-agricultural exports. This gives the country an export advantage in energy-related products, but it also creates exposure to global energy price shocks.
:::
## Worked example: calculating Oman's total trade value
Suppose Oman's GDP is US$114,667 million and trade is 48.9 percent of GDP.
We can estimate total trade as:
$$
X + M = 0.489 \times 114{,}667
$$
$$
X + M \approx 56{,}072 \text{ million US dollars}
$$
So Oman's total trade value is approximately US$56.1 billion.
This number means that foreign trade is large relative to the size of the economy, but the composition of trade matters. A country can have a high trade ratio and still face diversification challenges if exports are concentrated in a narrow group of products.
## Python application: visualizing Oman trade indicators
The following Python code creates simple tables and figures using the Oman trade values used in this chapter.
```{python}
#| label: tbl-oman-indicators
#| echo: true
import pandas as pd

indicators = pd.DataFrame({
    "Indicator": [
        "GDP, million current US dollars",
        "GDP per capita, US dollars",
        "Current account balance, percent of GDP",
        "Trade per capita, US dollars",
        "Trade, percent of GDP"
    ],
    "Value": [
        114667,
        20354,
        3.3,
        9949,
        48.9
    ]
})

indicators
```
```{python}
#| label: calc-oman-total-trade
#| echo: true
gdp = 114667
trade_percent_gdp = 48.9

total_trade = gdp * trade_percent_gdp / 100

print(f"Estimated total trade = {total_trade:,.1f} million US dollars")
```
```{python}
#| label: fig-oman-merchandise-trade
#| fig-cap: "Oman's merchandise trade by broad category."
#| fig-width: 7
#| fig-height: 4
#| fig-format: svg
#| echo: true
import matplotlib.pyplot as plt

merchandise_trade = pd.DataFrame({
    "Category": ["Agricultural products", "Non-agricultural products"],
    "Exports": [1834, 42718],
    "Imports": [5133, 25747]
})

ax = merchandise_trade.set_index("Category").plot(kind="bar")
ax.set_xlabel("")
ax.set_ylabel("Million US dollars")
ax.set_title("Oman merchandise trade by category")
plt.xticks(rotation=0)
plt.tight_layout()
plt.show()
```
```{python}
#| label: fig-oman-top-exports
#| fig-cap: "Top exported products in Oman by value."
#| fig-width: 7
#| fig-height: 4
#| fig-format: svg
#| echo: true
top_exports = pd.DataFrame({
    "Product": [
        "Petroleum oils, crude",
        "Petroleum gases",
        "Petroleum oils, other than crude",
        "Nitrogenous fertilizers",
        "Motor cars for transport of persons"
    ],
    "Value": [18686, 4403, 3865, 1498, 955]
})

ax = top_exports.plot(kind="barh", x="Product", y="Value", legend=False)
ax.set_xlabel("Million US dollars")
ax.set_ylabel("")
ax.set_title("Top exported products")
ax.invert_yaxis()
plt.tight_layout()
plt.show()
```
## Short application: Oman and diversification
Oman's export structure is concentrated in fuels and mining products. This has important implications:
1. **Trade-balance stability**
When oil and gas prices are high, export revenues and the trade balance improve. When energy prices fall, export revenues can decline sharply.
2. **Macroeconomic vulnerability**
Dependence on hydrocarbons exposes the economy to global energy price cycles.
3. **Food import dependence**
Agricultural imports such as wheat, milk products, and live animals matter for food security.
4. **Diversification challenge**
Diversification requires expanding non-oil exports, developing logistics and services, moving into higher value-added production, and strengthening productive capacity outside hydrocarbons.
## Connecting this chapter to the rest of the course
This introductory chapter gives the basic vocabulary. The rest of the course explains the mechanisms.
| Later chapter | Main question |
|---|---|
| Chp 2 Ricardian Model | How can countries gain from trade because of productivity differences? |
| Chp 3 Heckscher-Ohlin Model | How do resource endowments shape trade patterns and income distribution? |
| Chp 4 Gains from Trade | How do trade prices affect consumer surplus, producer surplus, and total welfare? |
| Chp 5 Import Barriers | What are the welfare effects of tariffs, quotas, and other import restrictions? |
| Chp 6 Export Policy | How do export subsidies, dumping, and export taxes affect welfare? |
| Chp 7 WTO and Agriculture | How do international rules discipline trade policy? |
| Chp 8 RTAs | When do regional trade agreements create or divert trade? |
| Chp 9 FX | How do exchange rates affect trade? |
| Chp 10 Gravity Model | Why do countries trade more with some partners than others? |
| Chp 11 Oman Trade Profile | What does Oman's trade structure reveal about specialization and vulnerability? |
## Key takeaway
International trade is the exchange of goods and services across borders. Countries trade because they differ in technology, resources, demand, and scale economies. Trade can increase national welfare, but it also changes prices, income distribution, and policy incentives.
For Oman, international trade is central to the economy. The country's trade profile shows both strength in energy-related exports and vulnerability from export concentration and agricultural import dependence.
## Review questions
1. Define exports, imports, trade surplus, and trade deficit.
2. What is the difference between international trade and international finance?
3. Explain two reasons why countries trade.
4. Write the formula for the trade openness ratio.
5. Why should trade openness not be interpreted as a direct measure of welfare?
6. What does Oman's export structure suggest about its comparative advantage?
7. Why can hydrocarbon export concentration create macroeconomic vulnerability?
8. Give one example of a trade policy instrument used by governments.
9. How can trade create winners and losers within the same country?
10. Why is agricultural trade important for food security in Oman?
## Practice problem
Oman has GDP of US$114,667 million. Suppose total trade is 48.9 percent of GDP.
1. Calculate total trade in million US dollars.
2. Interpret the result in one sentence.
3. Explain why the composition of exports matters in addition to the trade openness ratio.
4. Based on the product table, identify the sector where Oman appears to have the strongest export concentration.
5. Explain one possible risk of this concentration.